ElecNetKit ships with a couple of very powerful graphing tools. This article outlines the use of the graphs included with ElecNetKit, as well as the use of a window and control for hosting these graphs.
This topic contains the following sections.
ElecNetKit provides two methods for hosting graphs within WPF or console applications: GraphHost and GraphHostWindow. Each of these methods are outlined here.
GraphHost
GraphHost is a control that can be used in WPF windows. If you're writing an application with a custom user interface, this is probably what you're looking for. GraphHost is inherited from ![]() FrameworkElement, which means it provides all the usual events that WPF controls provide.
FrameworkElement, which means it provides all the usual events that WPF controls provide.
GraphHostWindow
If you don't really want to have to deal with your own UI, or plan on writing a console application, GraphHostWindow is the way to go. It launches a window that contains the specified graph. Incorporating GraphHostWindow in console applications entails a couple of extra requirements. If you're thinking of using GraphHostWindow for such applications, you may find Walkthrough: A Minimal Working Example helpful.
A couple of graphs come included with ElecNetKit. They are:
ValueTransformableTreeGraph
ValueTransformableTreeGraphs are top-down graphs that represent a network in terms of its geographical location.
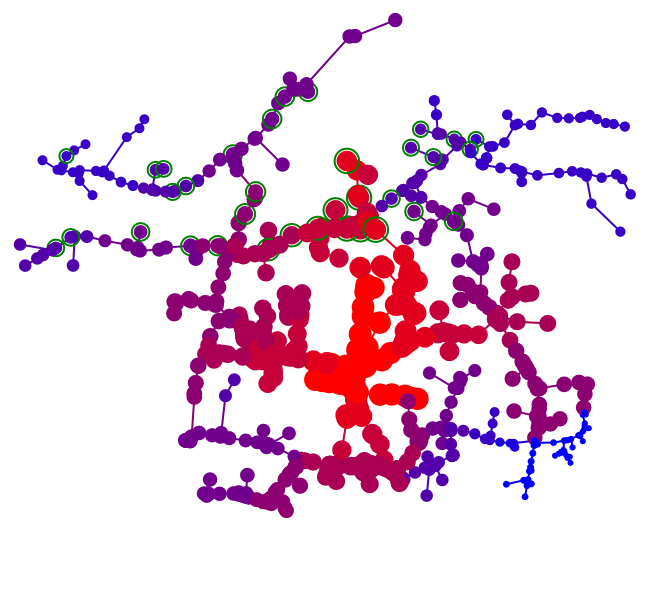
The positioning of network elements is a given, but the colour of buses (those small dots) and the lines connecting them, the size of buses and even the distance and visibility of those rings are controllable. Each one of these items is controlled by a Value Transform, a custom function that takes a Bus, and uses network model traversal (see Traversing the Network Model) to return some kind of data that should be displayed. In the example presented above, both BusColorTransform and BusSizeTransform are scaled with the lambda function:
Rings are only to be displayed on buses that have generation attached. As such, BusVisibleTransform is set with:
We don't care what size the ring is, just that it's visible, so we set to the RingDistanceTransform with:
Putting it all together, you can configure the graph as follows:
var graph = new ValueTransformableTreeGraph(); //new graph
graph.BusSizeMin = 2;
graph.BusSizeMax = 10;
graph.BusSizeTransform = bus => bus.VoltagePU.Magnitude;
graph.BusColorTransform = bus => bus.VoltagePU.Magnitude;
graph.RingEnabledTransform = bus => bus.ConnectedTo.OfType<Generator>().Any();
graph.RingDistanceTransform = bus => 2; //constant
graph.Network = network;
If you drop that code in instead of the graphing code outlined in Walkthrough: A Minimal Working Example, then you should get a result similar to the following image:
FeederProfileGraph
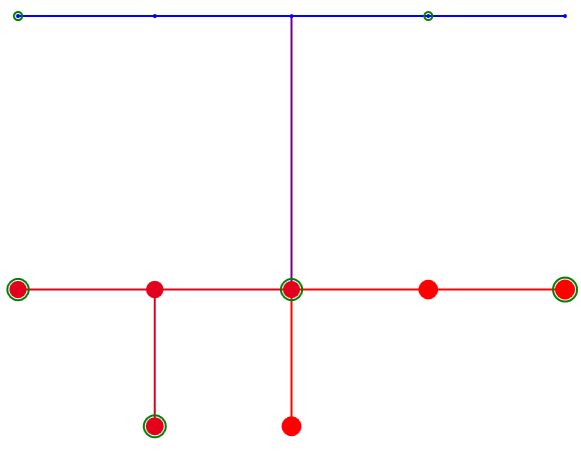
FeederProfileGraphs behave quite differently, plotting the voltage along the feeder against the cable distance from the source bus:
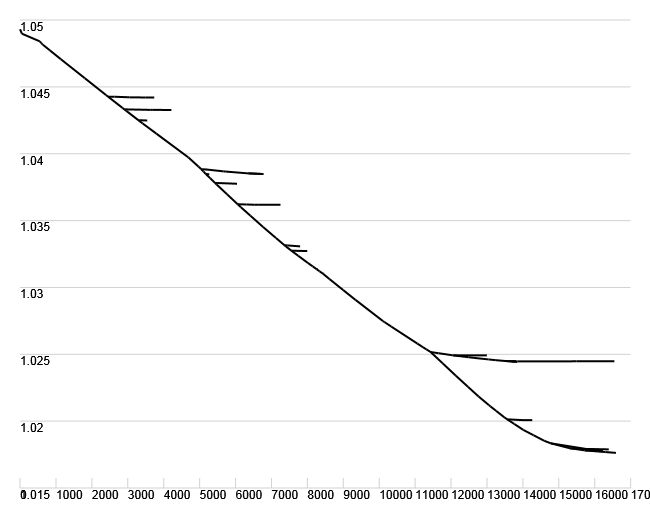
FeederProfileGraphs require a SelectedElement to be set - this governs the feeder that should be plotted. Any line that is required for connection of the SelectedElement to the SourceBus is included in the plot, along with any line from the SelectedElement away from the SourceBus to the end of the feeder. In the example above, then, the SelectedElement is located to the left of the first branch-point on the graph.